JVM memory management plays a crucial role in optimizing the performance and efficiency of Java applications. Understanding how the JVM handles memory allocation, garbage collection, and memory leaks is essential for Java developers. In this blog, we will delve into the best practices of JVM memory management in Java, providing examples that illustrate these concepts.
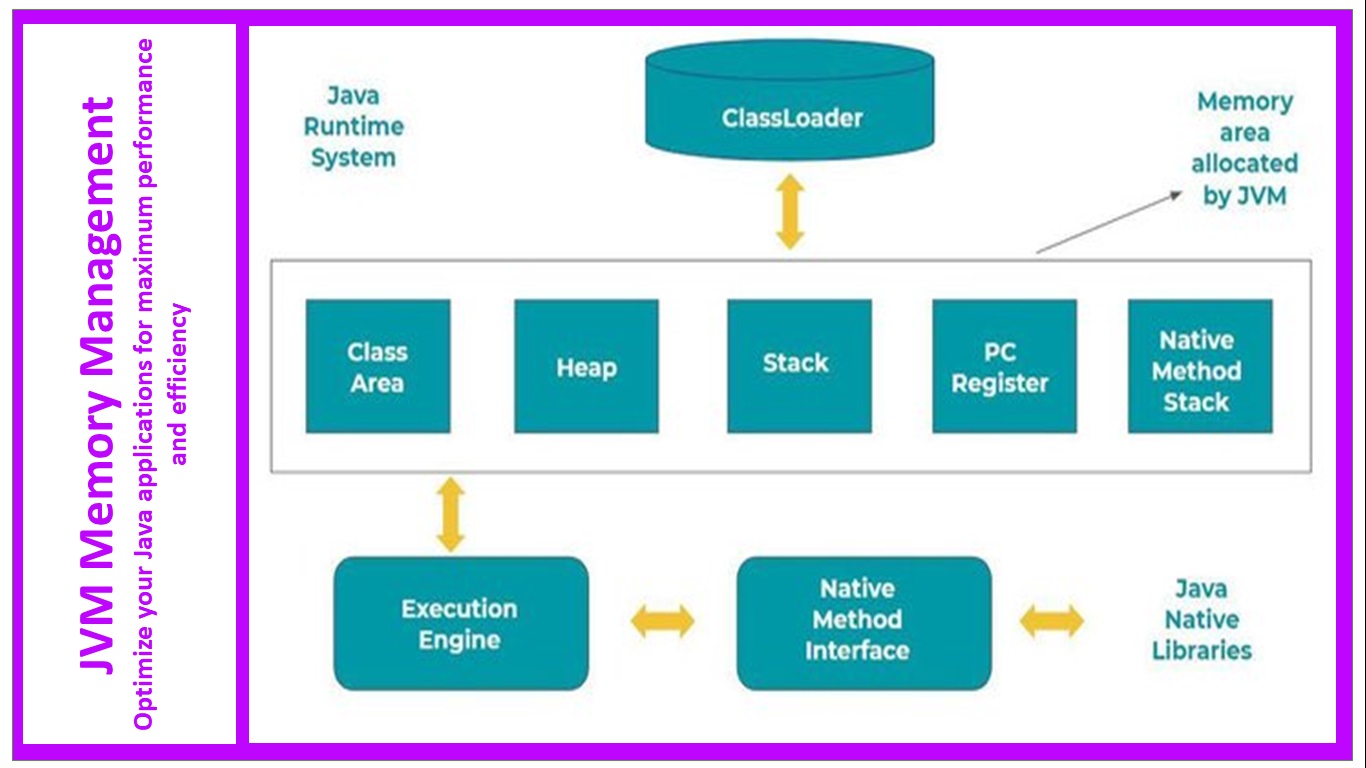
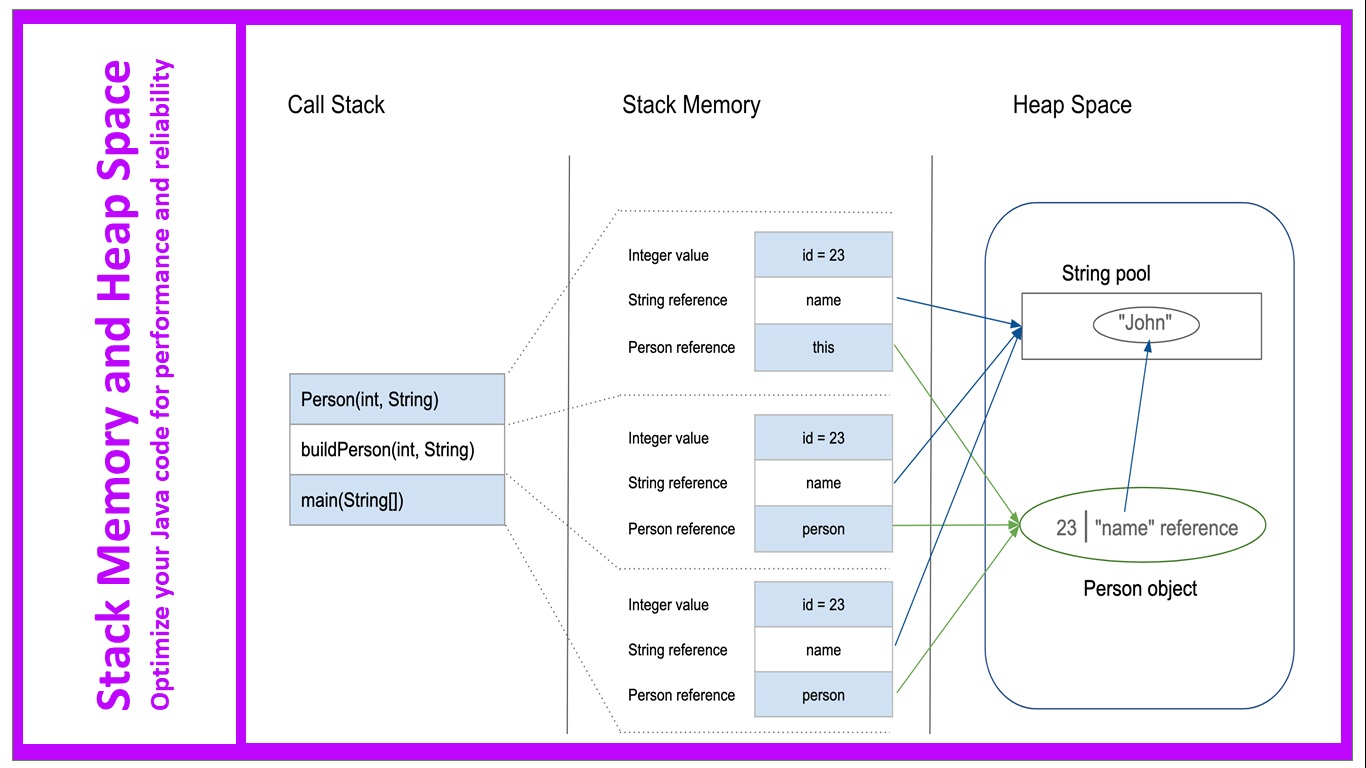
Before we dive into best practices, let's first understand the basic structure of JVM memory. The JVM memory is divided into several regions, each with its specific purpose:
Follow Object Lifecycle Management
One of the crucial aspects of JVM memory management is managing the lifecycle of objects efficiently. It is essential to clean up objects that are no longer needed to avoid memory leaks and unnecessary memory consumption. Here are some best practices related to object lifecycle management:
Tune JVM Heap Size
Determining the appropriate heap size for your Java application is crucial for optimal memory management. Setting heap size too low can cause frequent garbage collections, resulting in performance degradation. On the other hand, setting it too high can lead to wasted memory. Here's how you can tune the JVM heap size:
Understand and Configure Garbage Collection (GC)
Garbage collection is the process of reclaiming memory occupied by objects that are no longer referenced. Understanding the different types of garbage collectors available and configuring them appropriately can improve the overall performance of your Java application. Consider the following best practices for garbage collection:
Handle Memory Leaks
Memory leaks occur when objects are inadvertently kept in memory, preventing the garbage collector from reclaiming them. Identifying and addressing memory leaks is vital to ensure efficient memory utilization. Here are a few practices to handle memory leaks:
Let's demonstrate how to detect a memory leak scenario using VisualVM:
By following the best practices outlined above and leveraging tools like VisualVM, you can effectively detect and resolve memory leaks in your Java applications.
Effective JVM memory management is vital for optimizing the performance, reliability, and scalability of Java applications. By understanding the JVM memory structure, following object lifecycle management, properly tuning the heap size, configuring garbage collection, and addressing memory leaks, you can ensure efficient memory utilization. Remember, proactively managing memory in your Java applications leads to enhanced performance and a smoother user experience.


.jpg)